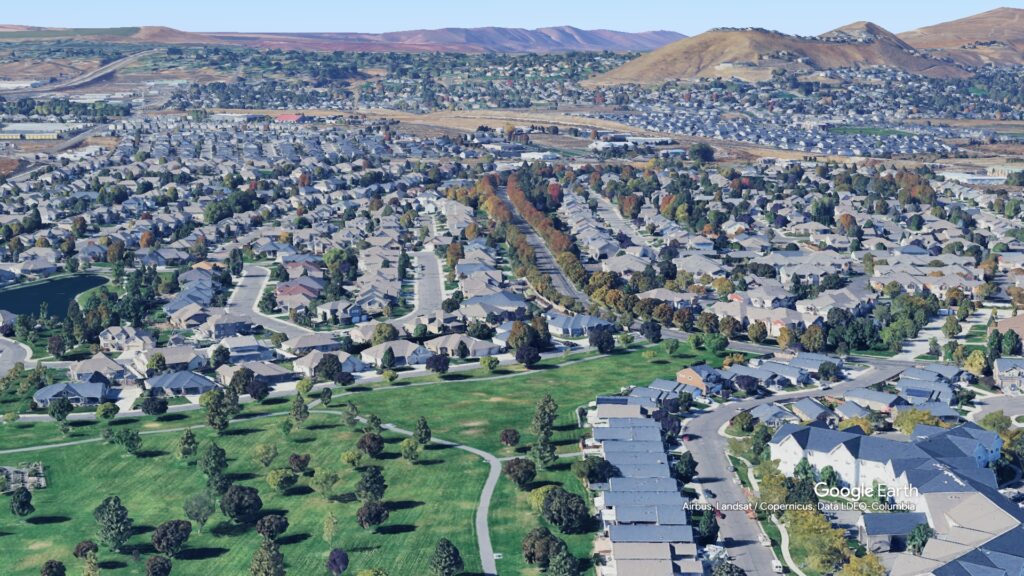
This blog post offers a detailed, side-by-side analysis of the existing construction, single-family home market in Hansen Park (within a 1-mile radius) versus the greater Tri-Cities area. We cover the past 12 months, 6 months, 3 months, 30 days, and the full month of March 2025. Our focus is on understanding key market trends like listing pace, pricing, days on market, and leverage conditions—so buyers and sellers can make informed decisions.
Past 12 Months (365 Days)
- Total Homes on Market per Day: Hansen Park: 76 total (1 every 4.8 days) | Tri-Cities: 3,865 total (10.59/day)
- Homes Sold per Day: Hansen Park: 67 total (1 every 5.4 days) | Tri-Cities: 3,777 total (10.35/day)
- Average Listing Price: Hansen Park: $504,380 | Tri-Cities: $505,868
- Median Listing Price: $450,000 for both
- Average Sale Price: Hansen Park: $492,183 | Tri-Cities: $494,171
- Median Sale Price: Hansen Park: $448,750 | Tri-Cities: $443,000
- Buyer’s Score: 2.80
- Seller’s Score: 7.20
Summary: The past year favored sellers in both markets. Hansen Park performed on par with the Tri-Cities but showed faster sales with lower days on market (30 vs. 38 average).
Last 6 Months (180 Days)
- Total Listings: Hansen Park: 36 | Tri-Cities: 1,301
- Total Sold: Hansen Park: 36 | Tri-Cities: 1,533
- Average Listing Price: Hansen Park: $514,911 | Tri-Cities: $520,039
- Median Sale Price: Hansen Park: $450,000 | Tri-Cities: $450,000
- Avg. Days on Market: Hansen Park: 30 | Tri-Cities: 34
- Buyer’s Score: 4.23
- Seller’s Score: 5.77
Summary: Seller leverage started to ease, and buyers saw slightly better conditions. Hansen Park continued to outpace the region in speed.
Last 3 Months (90 Days)
- Total Listings: Hansen Park: 21 | Tri-Cities: 655
- Total Sold: Hansen Park: 19 | Tri-Cities: 576
- Median Sale Price: Hansen Park: $450,000 | Tri-Cities: $469,000
- Avg. Days on Market: Hansen Park: 18 | Tri-Cities: 21
- Buyer’s Score: 3.54
- Seller’s Score: 6.46
Summary: Momentum favored sellers again, with Hansen Park showing exceptional turnover speed and strong sale prices.
Past 30 Days
- Total Listings: Hansen Park: 4 | Tri-Cities: 109
- Total Sold: Hansen Park: 3 | Tri-Cities: 67
- Average Sale Price: Hansen Park: $515,325 | Tri-Cities: $532,964Set featured image
- Avg. Days on Market: Hansen Park: 8 | Tri-Cities: 9
- Buyer’s Score: 4.38
- Seller’s Score: 5.62
Summary: Inventory and sales volume dipped, but market speed remained brisk. Both buyers and sellers had opportunity.
March 2025
- Total Listings: Hansen Park: 8 | Tri-Cities: 251
- Total Sold: Hansen Park: 11 | Tri-Cities: 180
- Median Sale Price: Hansen Park: $572,400 | Tri-Cities: $475,000
- Avg. Days on Market: Hansen Park: 20 | Tri-Cities: 20
- Buyer’s Score: 3.54
- Seller’s Score: 6.46
Summary: Hansen Park posted a standout month, beating the metro in both pricing and velocity.
Market Takeaways
- Speed to Sale: Hansen Park consistently outperformed the Tri-Cities metro in days on market across all timeframes.
- Strong Pricing: Especially in March and April data, Hansen Park held higher price points—evidence of sustained demand.
- Balanced Leverage: Scores indicate a shift away from seller dominance toward a more balanced market in both zones.
Hansen Park remains a strong micro-market within the Tri-Cities. Sellers benefit from fast-moving inventory and price strength, while buyers are seeing improved leverage conditions in recent months. With its consistent performance and elevated buyer interest, Hansen Park offers a reliable pulse on local real estate activity—and a potential advantage for those ready to act.

