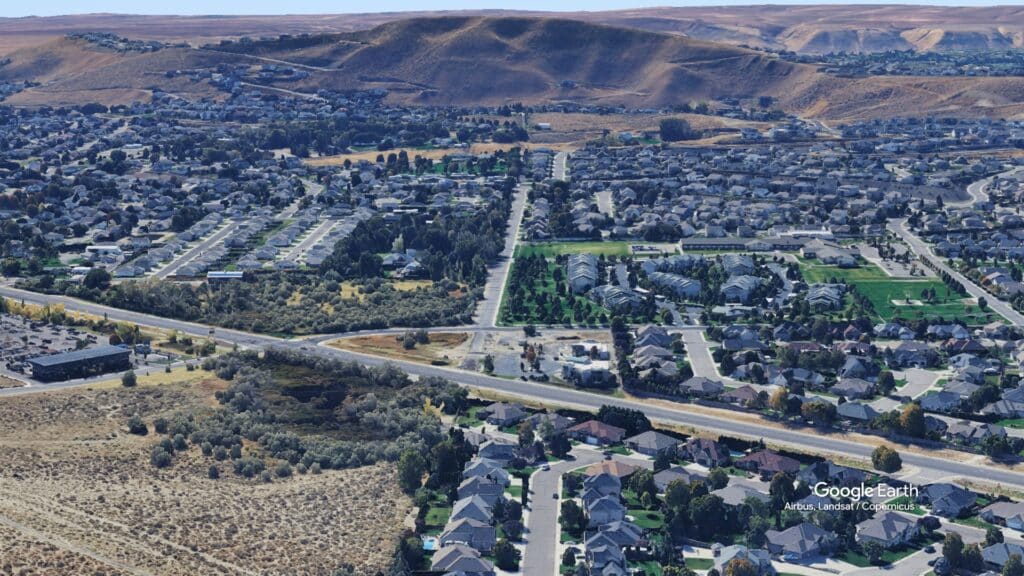
The housing market in Badger South, covering a 1-mile radius of the neighborhood, has seen some significant trends over the past year. Whether you’re looking to buy or sell, understanding these trends can help you make informed decisions. Let’s break down the latest market activity, pricing trends, and buyer-seller dynamics to see where the market is headed.
Market Activity: Listings & Sales Trends
Past 12 Months:
- A total of 43 homes came to market, averaging one new listing every 8.5 days.
- 28 homes were sold, meaning a sale occurred approximately every 13 days.
- The average home stayed on the market for 82 days, with a median of 59 days.
Recent Trends:
- In February 2025, 6 homes were listed, and 3 homes were sold.
- In March 2025 (current month so far), 2 new listings have entered the market, with no recorded sales yet.
- The average days on market in February was 53, showing a faster pace compared to the 12-month trend.
- Sales activity remains slower this month, which could mean a temporary cooling period before the summer market heats up.
Pricing Trends: Are Home Values Rising?
Listing Prices:
- Over the past year, the average original listing price was $621,461, with a median of $598,950.
- More recently, February listings had an average price of $727,050, showing an upward trend.
- So far in March, the average listing price is $749,450, indicating sellers are pricing homes higher.
Final Sale Prices:
- The average final sale price over the past 12 months was $564,124, with a median of $554,950.
- In February 2025, homes sold for an average of $538,000, suggesting buyers have had more negotiating power.
- However, the gap between listing and selling prices has narrowed, meaning homes are closing closer to their asking prices compared to earlier months.
Price Per Square Foot:
- Over the past year, the average price per square foot was $254.02.
- In February 2025, this figure was $244.38, slightly lower, but still within the market’s expected range.
- The increase in March’s listing prices suggests a potential rise in price per square foot as demand picks up.
Buyer & Seller Market Conditions
One of the best indicators of market strength is the Buyer and Seller Scores:
- Over the past year, the market was relatively balanced, with a Buyer Score of 4.6 and a Seller Score of 5.4.
- Recently, in February 2025, the Buyer Score dropped to 5.7, and the Seller Score dropped to 4.3.
- March’s Buyer Score is 6.5, showing a shift toward a more buyer-friendly market.
What does this mean? Buyers are gaining more negotiating power, likely due to an increase in available listings and slightly slower sales activity. For sellers, pricing competitively and staging homes well will be key to closing deals quickly.
Key Takeaways for Buyers & Sellers
For Buyers:
- More listings in recent months give you more options to choose from.
- Homes are spending slightly more time on the market, meaning you may have more room to negotiate.
- Prices remain steady but may rise in the summer months, so acting soon could be a smart move.
For Sellers:
- The market is leaning toward buyers, so strategic pricing is essential.
- Homes are still selling, but the average time on market suggests patience is key.
- If you’re planning to sell, proper home preparation and competitive pricing will help attract serious buyers.
Final Thoughts
Badger South’s real estate market is at an interesting point—sellers have seen rising prices, but buyers now have more leverage. The next few months will be key in determining whether the market leans further toward buyers or if a resurgence in demand shifts things back toward sellers. If you’re looking to buy or sell a home in Badger South, now is the time to stay informed and make strategic decisions.
For expert guidance, contact Ryan Rose at Kenmore Team for personalized market insights and real estate assistance.

