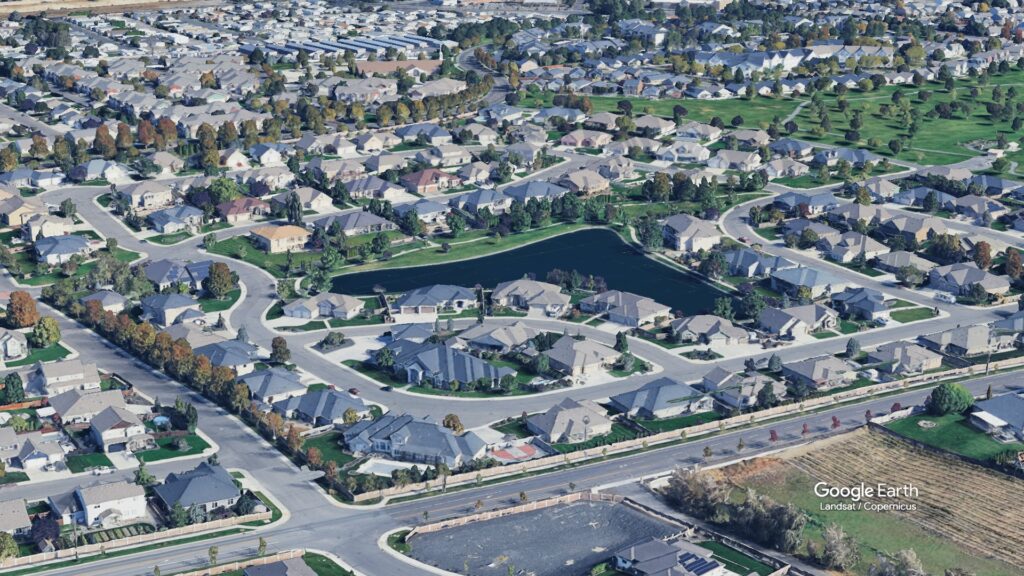
When buyers and sellers evaluate the housing market, it helps to zoom in and out—looking both at neighborhood-level trends and metro-wide dynamics. In this post, we compare the past 3 months of market activity in Hansen Park (within a 1-mile radius) to the broader Tri-Cities metro area. This snapshot includes only existing construction, single-family homes and provides insight into price points, sales pace, and market leverage.
Comparison Overview (Past 90 Days)
| Metric | Hansen Park | Tri-Cities Metro |
|---|---|---|
| Total Listings | 21 (1 every 4.3 days) | 655 (7.28 per day) |
| Total Sold | 19 (1 every 4.7 days) | 576 (6.40 per day) |
| Avg. List Price | $500,967 | $531,033 |
| Median List Price | $450,000 | $473,900 |
| Avg. Sale Price | $500,805 | $527,046 |
| Median Sale Price | $450,000 | $469,000 |
| Avg. Days on Market | 18 | 21 |
| Median Days on Market | 18 | 25 |
| Buyer Score | 3.54 | 3.54 |
| Seller Score | 6.46 | 6.46 |
Key Takeaways
- Listing Activity: Tri-Cities had significantly more activity, though Hansen Park maintained a consistent flow of new listings and closings every few days.
- Prices: Hansen Park trailed slightly in average and median pricing, but values held strong relative to the broader market.
- Days on Market: Homes in Hansen Park moved even faster than the metro average, underscoring local demand.
- Market Leverage: Scores were identical, reinforcing that both markets were favorable to sellers during this period, with balanced leverage emerging.
Conclusion The Hansen Park market in the past 90 days remained competitive and efficient, with quick sales and steady prices. While slightly below metro averages in price, the area outpaced the Tri-Cities in speed. Buyers and sellers alike can view Hansen Park as a dynamic, in-demand neighborhood that tracks regional trends with an edge in velocity.

