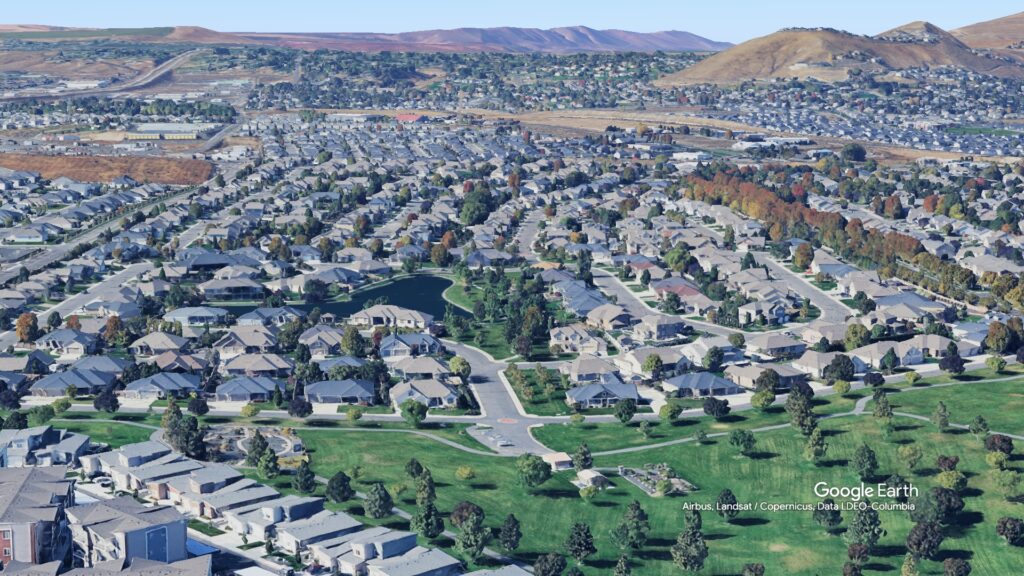
When buyers and sellers evaluate the housing market, it helps to zoom in and out—looking both at neighborhood-level trends and metro-wide dynamics. In this post, we compare March 2025 market activity in Hansen Park (within a 1-mile radius) to the broader Tri-Cities area. This snapshot includes only existing construction, single-family homes and provides insight into price points, sales pace, and market leverage.
Comparison Overview (March 2025)
| Metric | Hansen Park | Tri-Cities Metro |
|---|---|---|
| Total Listings | 8 (1 every 3.9 days) | 251 (8.1 per day) |
| Total Sold | 11 (1 every 2.8 days) | 180 (5.81 per day) |
| Avg. List Price | $581,963 | $531,148 |
| Median List Price | $556,950 | $475,000 |
| Avg. Sale Price | $585,213 | $528,380 |
| Median Sale Price | $572,400 | $475,000 |
| Avg. Days on Market | 20 | 20 |
| Median Days on Market | 21 | 18 |
| Buyer Score | 3.54 | 3.54 |
| Seller Score | 6.46 | 6.46 |
Key Takeaways
- Listing Activity: Hansen Park was active with new inventory and strong sales. While Tri-Cities had more volume, Hansen Park’s activity was relatively brisk for its size.
- Prices: Hansen Park significantly outpaced the metro area in both average and median prices, signaling elevated demand or higher-value inventory.
- Days on Market: Both areas had similar speed, with homes selling within two to three weeks on average.
- Market Leverage: Matching scores across the board reflected a seller-friendly environment, though buyers had some negotiating room.
Conclusion In March 2025, Hansen Park showed strong pricing performance and an impressive sales pace. While the broader Tri-Cities market moved quickly and steadily, Hansen Park led in home values and matched speed. These trends suggest that Hansen Park continues to be a high-demand micro-market within the Tri-Cities, offering sellers an opportunity to capitalize and giving buyers a reason to move quickly.

