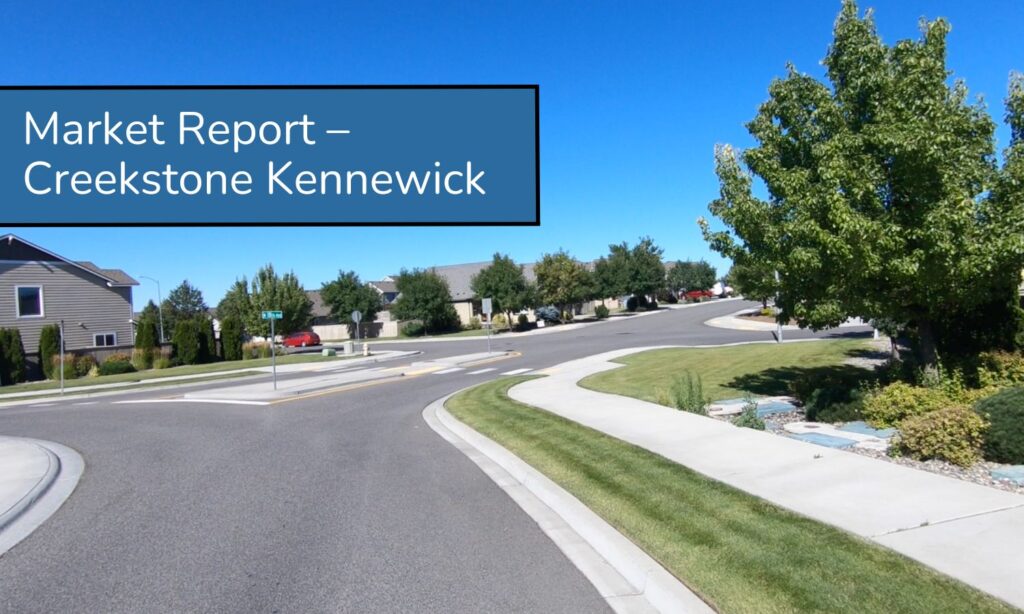
When it comes to real estate in Kennewick, Creekstone and the surrounding area of West Kennewick stands out as a unique and desirable neighborhood. Understanding how Creekstone compares to the Kennewick market is key for both buyers and sellers. This market report will highlight key market trends, including listing activity, pricing, and market dynamics.
- The pace of listings and sales in Kennewick vs. Creekstone
- Trends in home sizes, prices, and price per square foot
- Buyer and seller dynamics in each market
Key Market Trends
1. Total Market Listings
Kennewick saw a total of 960 listings over the past 12 months, averaging 2.62 new listings per day. In comparison, Creekstone had 103 total listings, averaging one new listing every 3.6 days. Creekstone represents about 10.7% of Kennewick’s total listings, indicating a smaller but significant share of the market. The slower pace of new listings in Creekstone reflects a tighter inventory and greater competition among buyers.
2. Sold Listings
Kennewick recorded 749 sold listings over the past year, averaging 2.05 listings sold per day. Creekstone, on the other hand, had 77 sold listings, averaging one sale every 4.8 days. Creekstone accounted for 10.3% of Kennewick’s sold listings, demonstrating consistent demand across both markets.
3. Days on Market (DOM)
Homes in Creekstone tend to sell faster than those in Kennewick. The average DOM in Creekstone is 46 days, compared to 55 days in Kennewick—a 16% improvement. However, the median DOM is identical at 31 days for both markets, indicating that while some homes in Creekstone sell faster, the majority of homes take a similar amount of time to sell.
4. Price Trends
The average original listing price in Creekstone is $512,583, about 1.7% higher than Kennewick’s $504,121. Similarly, the average final sale price in Creekstone is $501,613, compared to $490,455 in Kennewick—a 2.3% increase. The median listing and final prices in Creekstone are notably higher, reflecting the neighborhood’s premium appeal.
5. Price per Square Foot
Despite higher listing and sale prices, Creekstone offers better value on a per-square-foot basis. The average price per square foot in Creekstone is $233.73, about 2% lower than Kennewick’s $238.49. This is largely due to the larger average home size in Creekstone.
6. Home Sizes
Homes in Creekstone are generally larger than those in Kennewick. The average home size in Creekstone is 2,245 square feet, compared to 2,149 square feet in Kennewick—a 4.5% increase. The median size also reflects this trend, with Creekstone homes having a median size of 2,058 square feet, compared to Kennewick’s 1,972 square feet.
7. Buyer and Seller Scores
Kennewick’s buyer score is 3.7, while Creekstone’s is 2.8. On the seller side, Kennewick scores 6.3, compared to Creekstone’s 7.2. These scores indicate that Creekstone is a stronger seller’s market than Kennewick, with higher competition among buyers and more favorable conditions for sellers.
Final Thoughts
Creekstone stands out as a premium neighborhood within Kennewick, offering larger homes at slightly lower price per square foot while commanding higher listing and sale prices overall. The market dynamics show that sellers in Creekstone have more leverage, while buyers face tighter inventory and heightened competition.
Whether you’re a buyer looking for value or a seller aiming to maximize your return, understanding these localized market trends is essential. For personalized advice on buying or selling in Creekstone or Kennewick, reach out to ryan@kenmoreteam.com or call 509.987.4544. Let our team help you navigate this competitive market with confidence!

