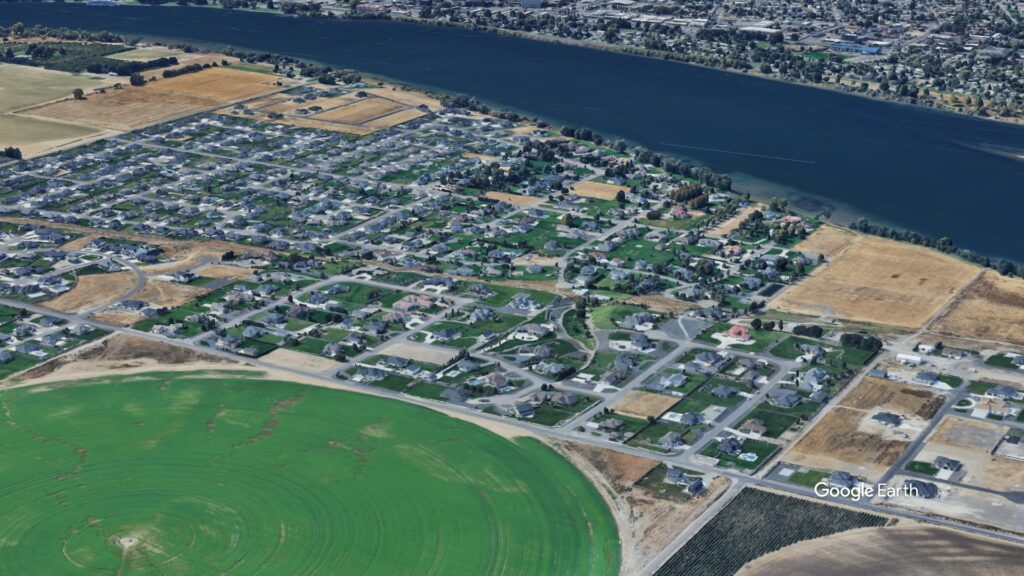
Pasco has been one of the fastest-growing markets in the Tri-Cities, and recent trends indicate a shift toward a seller’s market for new construction homes. With homes selling faster and inventory tightening, buyers are seeing fewer price reductions and more competition.
By analyzing data from the past 12 months, year-to-date (YTD), the last full month, and the current month, we can uncover key trends impacting home prices, listing activity, and days on market. Using buyer and seller scores, we’ll provide insights into what this means for buyers and sellers in Pasco.
Market Overview: A Year in Review
Over the past 12 months, Pasco saw 349 new listings, averaging 1 new listing per day. Meanwhile, 228 homes sold, averaging one sale every 1.6 days.
Pricing Trends
- Average Listing Price: $549,728
- Median Listing Price: $469,920
- Final Sold Price (Avg.): $498,658
- Final Sold Price (Median): $439,993
- Price per Sq. Ft. (Avg.): $283.04
Days on Market (DOM)
- Average DOM: 106 days
- Median DOM: 55 days
- Maximum DOM: 842 days
Market Conditions
- Buyer Score: 4.6 (Indicating moderate buyer strength)
- Seller Score: 5.4 (Suggesting sellers still had an edge)
Key Takeaway: Pasco remained fairly balanced over the last year, with moderate buyer leverage and homes staying on the market longer than in neighboring Tri-Cities areas.
Year-to-Date: Pasco’s 2025 Market Performance
So far in 2025, 38 new listings have hit the market, translating to one new listing every 1.4 days. Meanwhile, 28 homes have sold, meaning one sale every 1.9 days.
Year-to-Date Buyer & Seller Scores
- Buyer Score: 3.6
- Seller Score: 6.4
This clear shift toward sellers indicates that buyers are losing leverage. Homes are selling faster, and sellers are negotiating less.
Last Full Month: January 2025 Market Insights
In January 2025, Pasco had 30 new listings, averaging one new listing per day. Meanwhile, 15 homes sold, translating to one sale every 2.1 days.
Price Trends
- Average Listing Price: $717,052
- Median Listing Price: $563,073
- Final Sold Price (Avg.): $545,397
- Final Sold Price (Median): $456,850
Days on Market
- Average DOM: 172 days
- Median DOM: 72 days
Buyer & Seller Scores
- Buyer Score: 6.3
- Seller Score: 3.7
Market Takeaway: January favored buyers, as homes sat on the market longer, and sellers had to negotiate more aggressively to close deals.
Current Month: February 2025 Trends
February marks a strong shift toward sellers. So far, 8 new listings have entered the market, averaging one new listing every 2.6 days. Meanwhile, 13 homes have sold, meaning one sale every 1.6 days.
Price Trends
- Average Listing Price: $536,998
- Median Listing Price: $485,850
- Final Sold Price (Avg.): $513,425
- Final Sold Price (Median): $440,325
Days on Market
- Average DOM: 144 days
- Median DOM: 135 days
Buyer & Seller Scores
- Buyer Score: 3.1
- Seller Score: 6.9
Key Insight: February data confirms a strong seller’s market. Fewer listings are available, homes are selling at higher prices, and buyers have significantly less negotiating power.
Key Market Trends and What They Mean for You
1. Homes Are Selling Faster
- January’s average DOM: 172 days → February’s average DOM: 144 days
- January’s median DOM: 72 days → February’s median DOM: 135 days
Although average days on market remain high, homes are selling faster than they did in late 2024.
What this means: If you’re a seller, listing now increases your chances of selling quickly.
2. Buyer Power is Dwindling
- January Buyer Score: 6.3 | Seller Score: 3.7
- February Buyer Score: 3.1 | Seller Score: 6.9
The market has strongly shifted toward sellers.
What this means: Buyers should prepare to act quickly and expect fewer price reductions.
3. Prices Are Stabilizing
- February’s average final price ($513,425) is close to January’s ($545,397)
- The gap between listing and final prices is shrinking
What this means: Pasco’s prices are holding firm, making lowball offers unlikely to succeed.
4. Low Inventory is Fueling Competition
With only 8 new listings in February so far, the supply of homes remains tight.
What this means: Buyers will face more competition and possible multiple-offer situations.
Final Thoughts: What Should You Do Next?
For Sellers:
- Now is the best time to list. Buyer demand is increasing, and homes are selling with fewer price reductions.
- Homes are moving faster, especially compared to late 2024.
For Buyers:
- Be ready to move quickly. Homes are selling faster, and seller power is increasing.
- Get pre-approved before house hunting. A strong financial position will help you stand out in a competitive market.
- Expect fewer negotiations. The market is favoring sellers more each month.
Looking Ahead
With February’s numbers favoring sellers, Pasco’s market is expected to remain competitive in the coming months. If inventory stays low, prices will continue to hold firm, and buyers will need to be aggressive to secure a home.
If you’re thinking about buying or selling, acting now could save you money or help you maximize your sale price.
Need Help?
For expert guidance on buying or selling in Pasco, reach out to ryan@kenmoreteam.com or call 509.987.4544. Staying informed and working with professionals will help you navigate this fast-changing market.

